I installed the Arduino IDE on my laptop and added the SparkFun Apollo3 boards manager.
Tasks
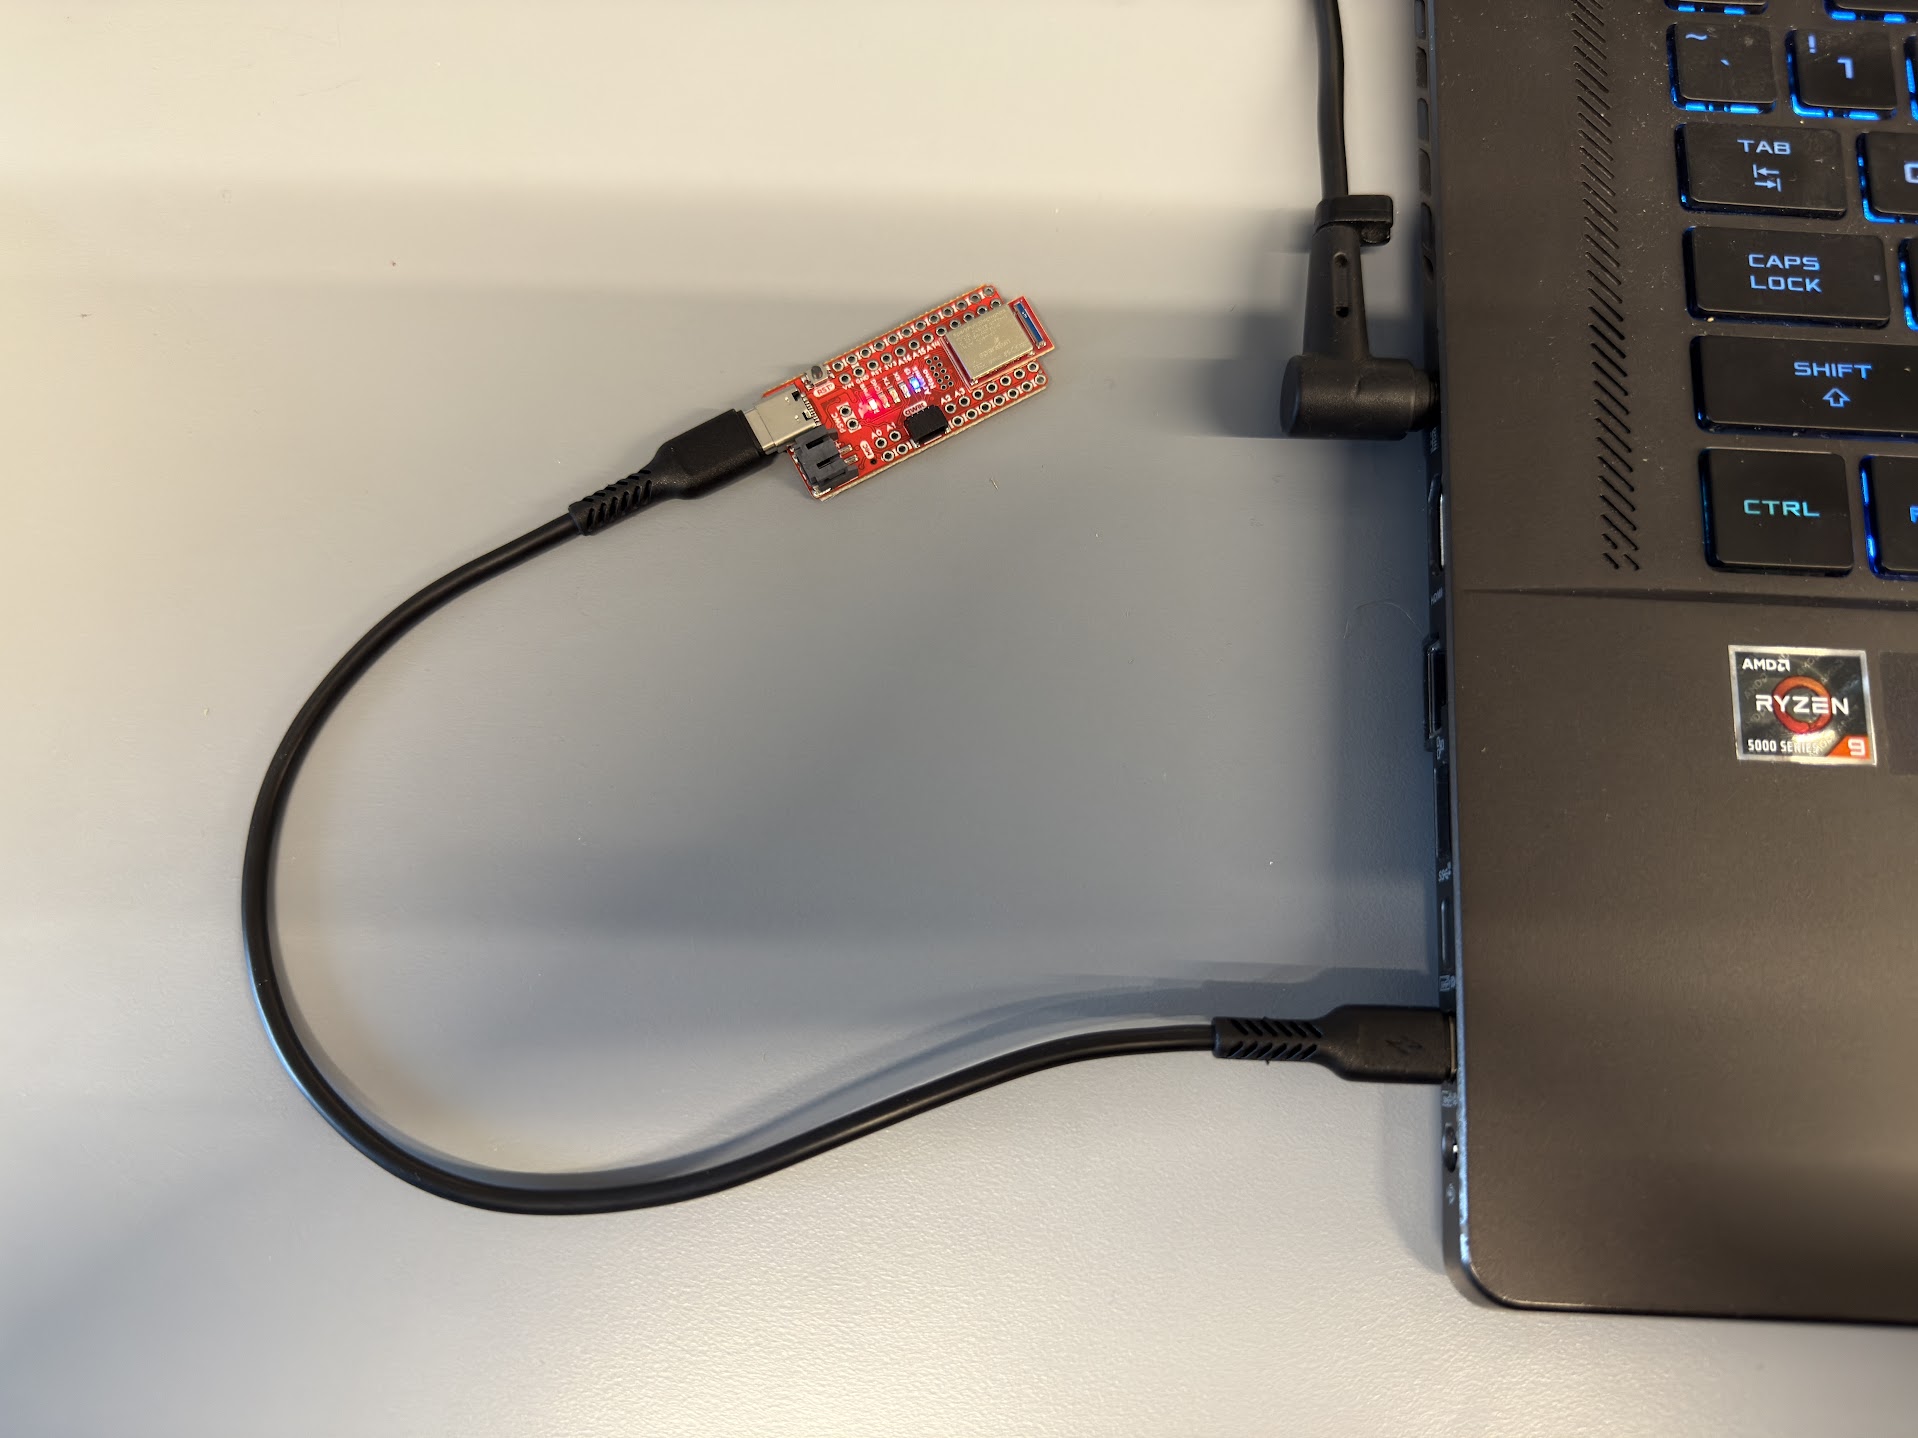
I connected the Artemis board to my laptop and selected Redboard Artemis Nano as the board.
I ran the Blink example to test the LED. The blue LED on the board turns on for 1 second and turns off for another second repeatedly.
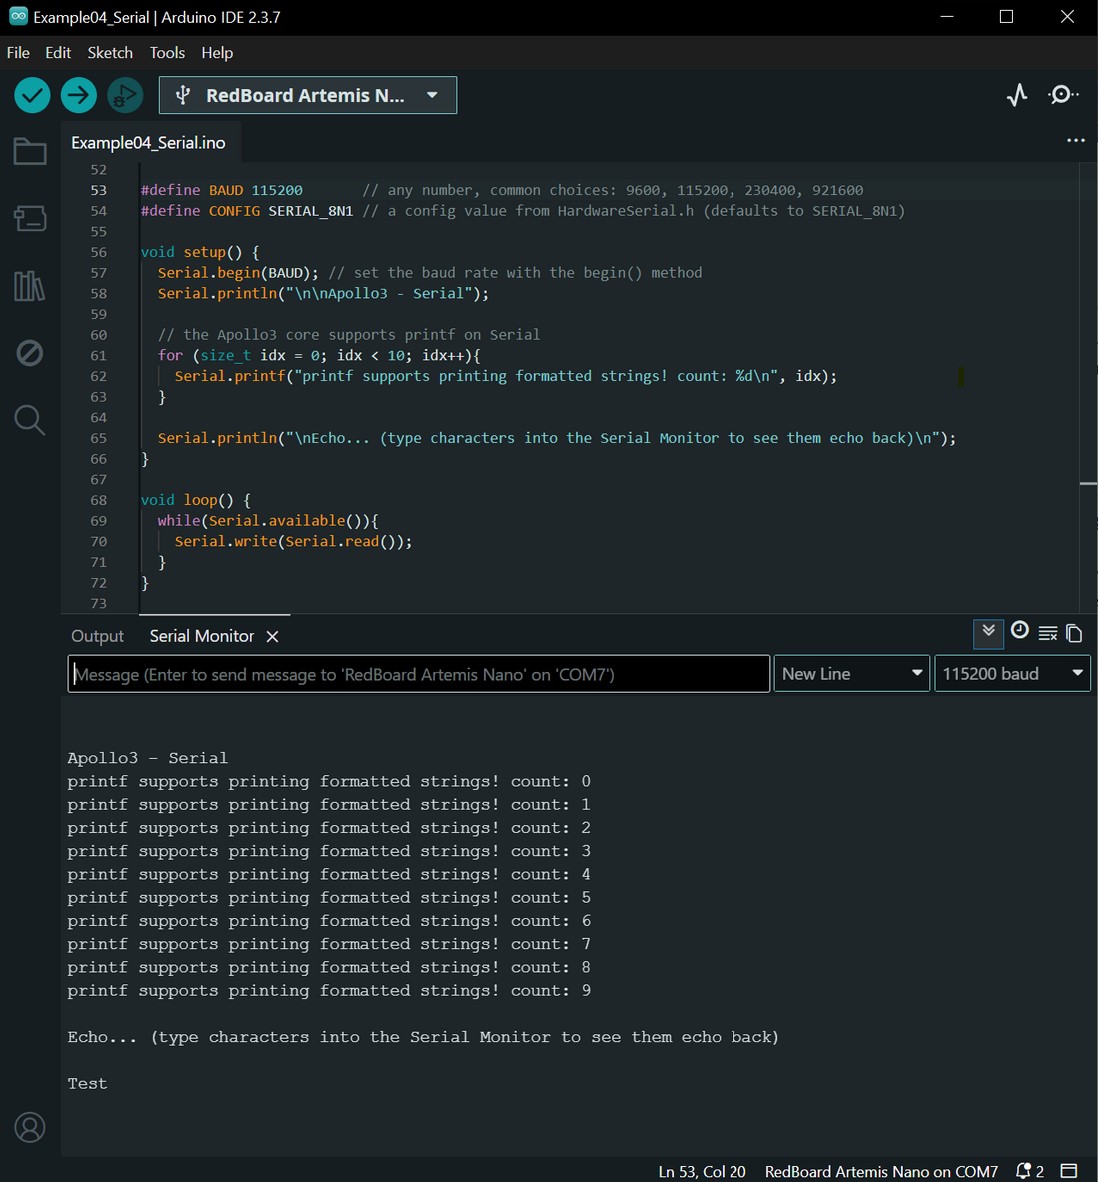
I ran the Example4_Serial example to test the serial printing. I set the baud rate in the Serial Monitor to 115200 baud and made sure it is the same value in the sketch. I typed in “Test” as the message, and the serial monitor printed “Test”.
I ran the Example2_analogRead example to retrieve the analog value of the chip’s temperature. I placed my finger on the chip of the Artemis Nano board. Before I placed my finger on the chip, the temp count was about 32900. After placing my finger on the chip for at least 1 minute, the temp count increased to about 33250.
I ran the Example1_MicrophoneOutput example to test the microphone. When playing a frequency of 250 Hz, the Serial Monitor shows the loudest frequency as 251 Hz. Playing 500 Hz shows the loudest frequency as 503 Hz.
Additional Tasks for 5000-Level Students
Using Wikipedia’s Piano key frequencies article, I chose a’ (440 Hz), a’’ (880 Hz), and a’’’ (1760 Hz). In a new sketch, I copied the code from Example1_MicrophoneOutput, commented out Line 124 and added the following code after that line. If the frequency played is +/- 10 Hz of the desired musical note, display the corresponding musical note. Otherwise, the Serial Monitor displays “Frequency out of range”.
if(ui32LoudestFrequency>=430&&ui32LoudestFrequency<=450){// 440 HzSerial.println("Piano musical note: a'");}elseif(ui32LoudestFrequency>=870&&ui32LoudestFrequency<=890){// 880 HzSerial.println("Piano musical note: a''");}elseif(ui32LoudestFrequency>=1750&&ui32LoudestFrequency<=1770){// 1760 HzSerial.println("Piano musical note: a'''");}else{Serial.println("Frequency out of range");}
Lab 1B
Prelab
I installed Python 3.13 and pip. I created a new virtual environment using Command Prompt and installed the necessary Python packages. I installed the codebase into my project directory. I installed the ArduinoBLE library and uploaded ble_arduino.ino to the Artemis board. I confirmed that the Artemis board is printing its MAC address.
Configurations
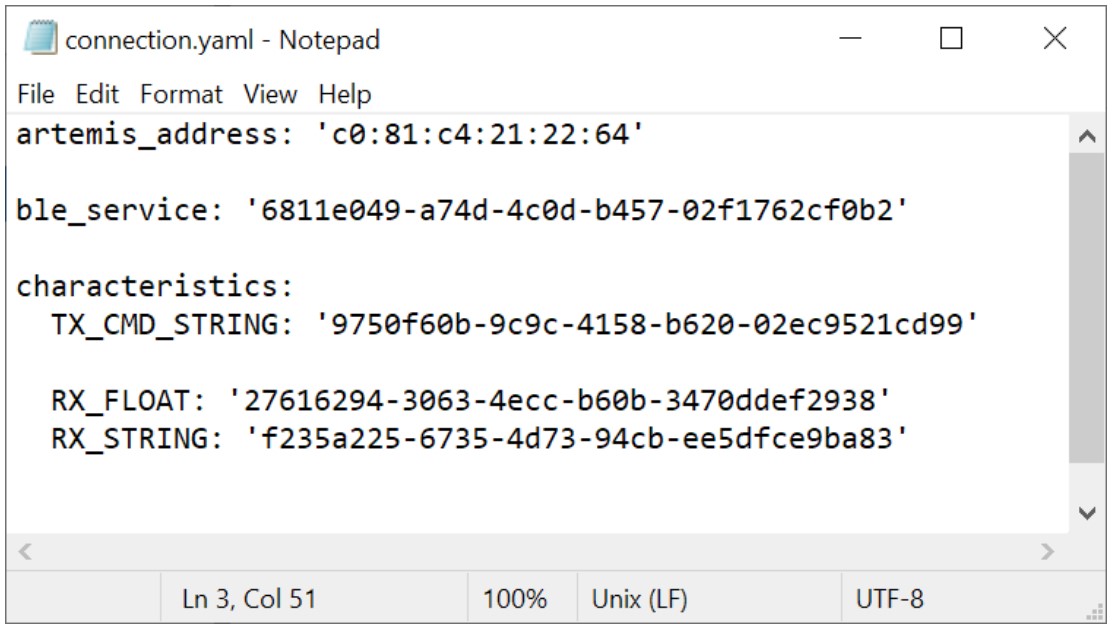
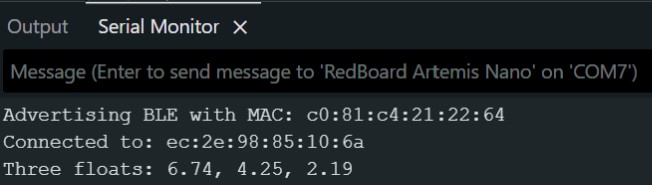
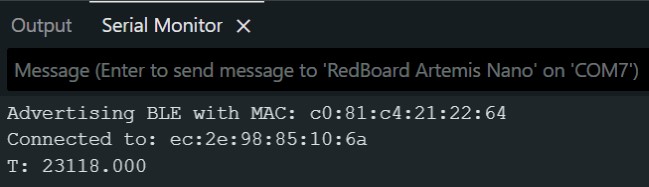
In connections.yaml, I updated the MAC address to artemis_address: 'c0:81:c4:21:22:64', using the address printed in Serial Monitor.
<img src="/MAE-5190-Sean-Zhen/assets/images/Lab1B_Configs1.jpg width="480">
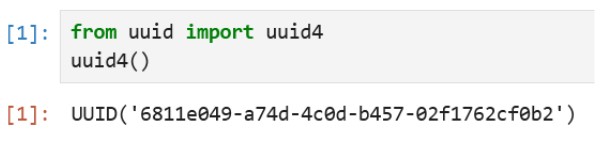
In a new Jupyter notebook, I ran the following code to generate a new UUID.
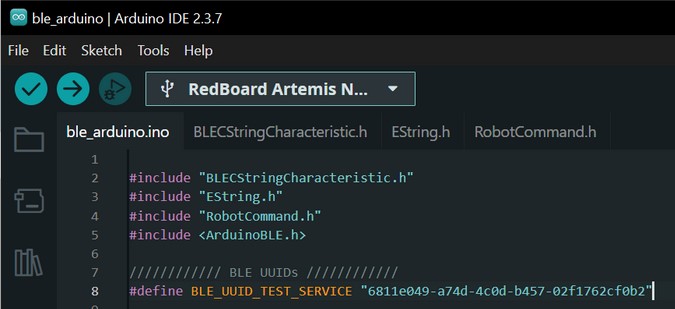
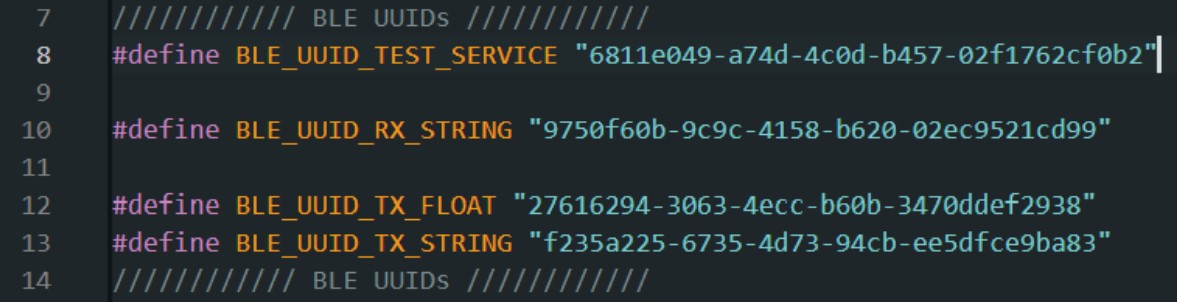
In ble_arduino.ino, I replaced the BLEService UUID with the generated UUID.
In connections.yaml, I replaced ble_service with the generated UUID.
I checked the UUIDs in ble_arduino.ino and connections.yaml to make sure they are the same.
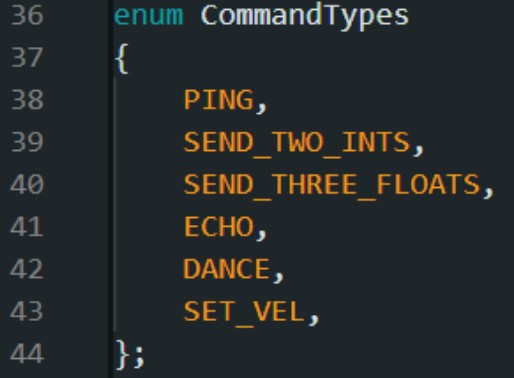
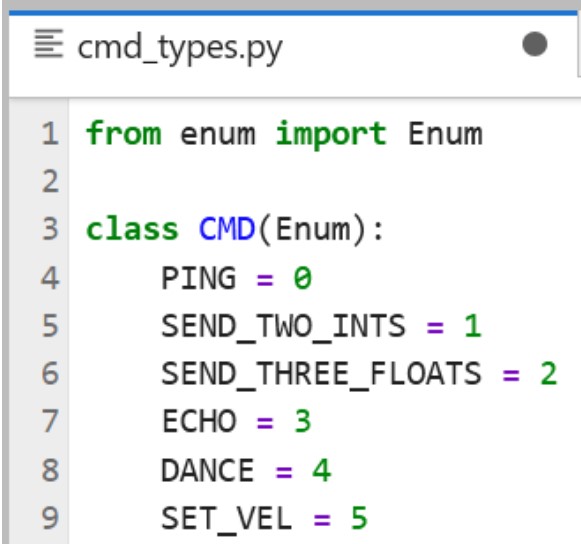
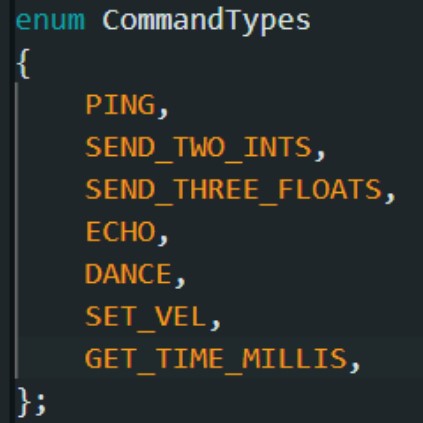
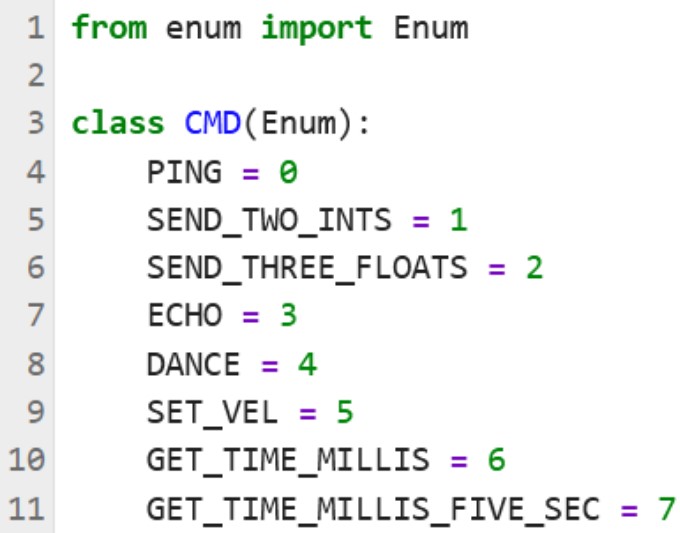
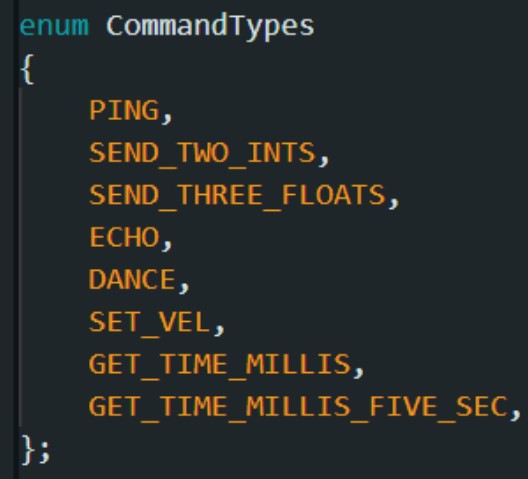
I checked that the command types defined in enum CommandTypes in ble_arduino.ino are the same as the ones defined in cmd_types.py.
I uploaded ble_arduino.ino to the Artemis board.
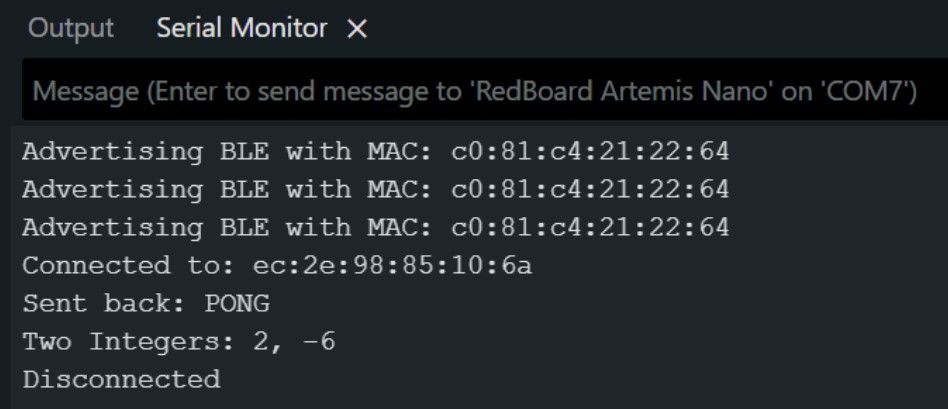
I ran all of the code blocks in demo.ipynb. This is the output displayed in the Serial Monitor.
Tasks
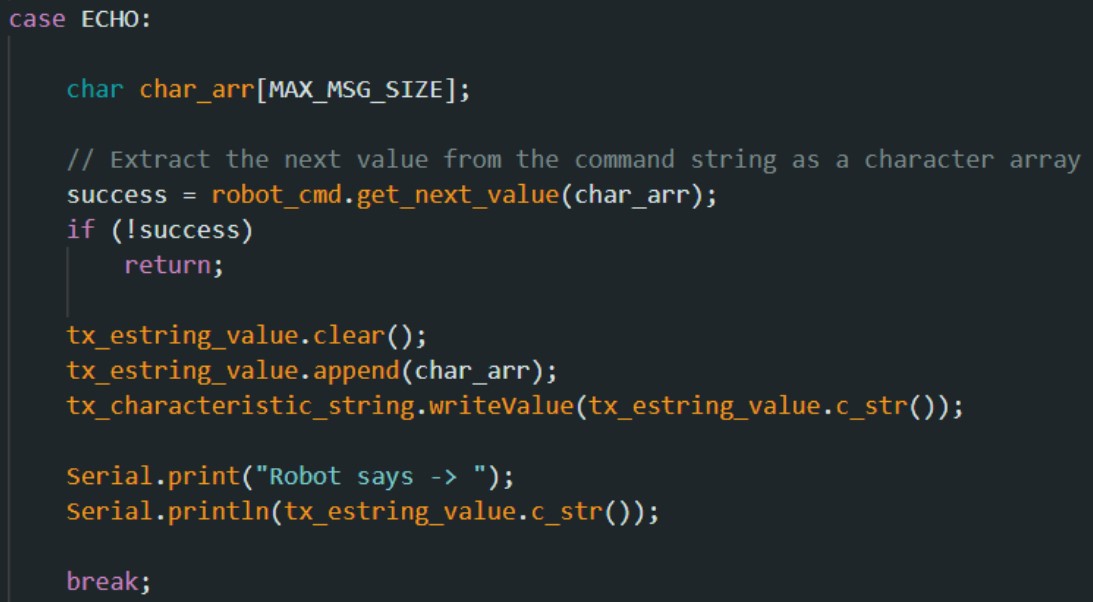
In case ECHO, I added the following code.
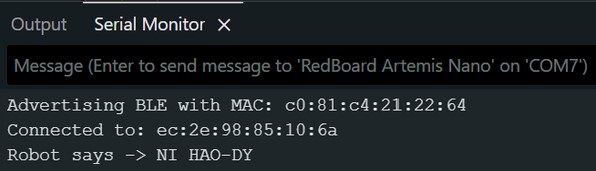
In a Jupyter notebook, I ran the following code to send the string value NI HAO-DY.
The Artemis board received the string value and printed an augmented string to the Serial Monitor.
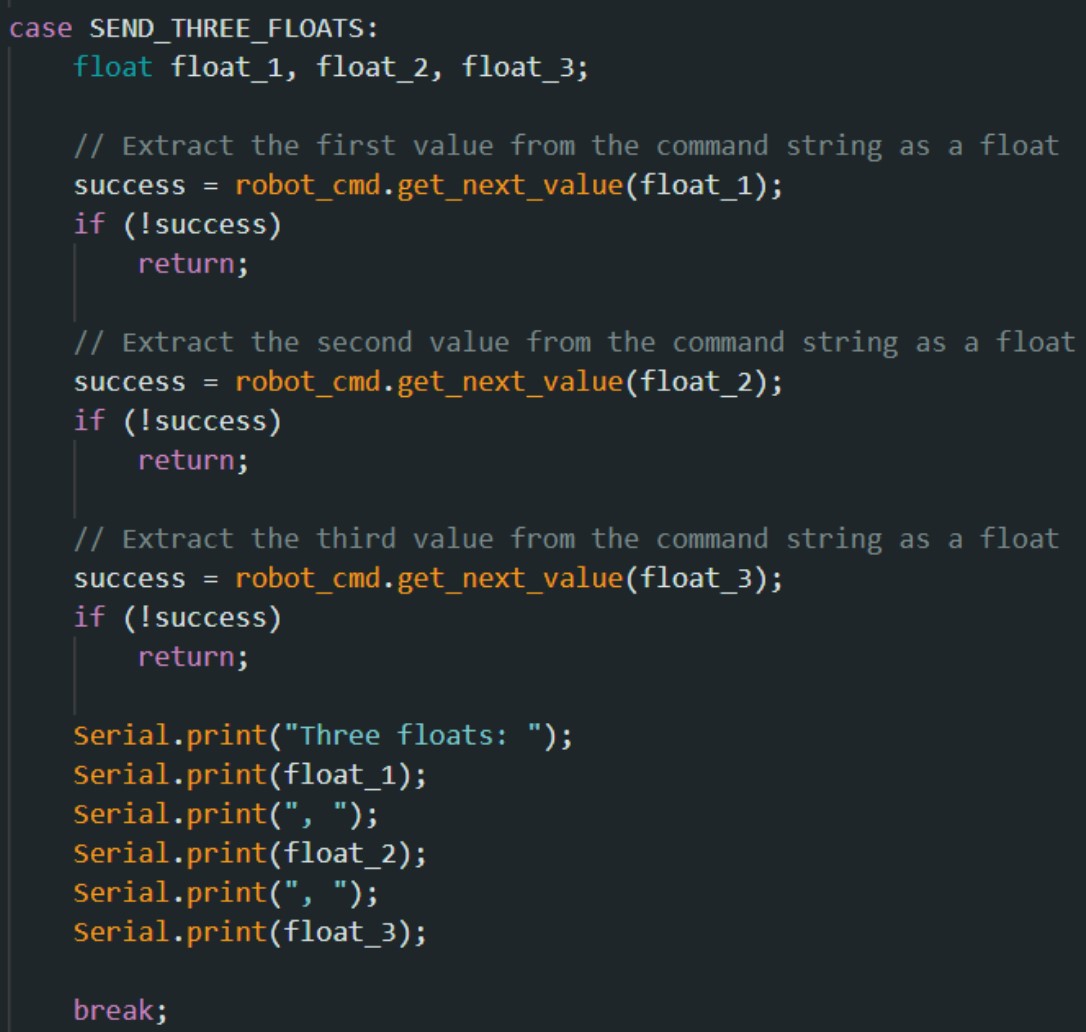
In case SEND_THREE_FLOATS, I wrote the following code.
In a Jupyter notebook, I ran the following code to send three floats, 6.74, 4.25, and 2.19.
The Artemis board received the three floats and the values are printed in the Serial Monitor.
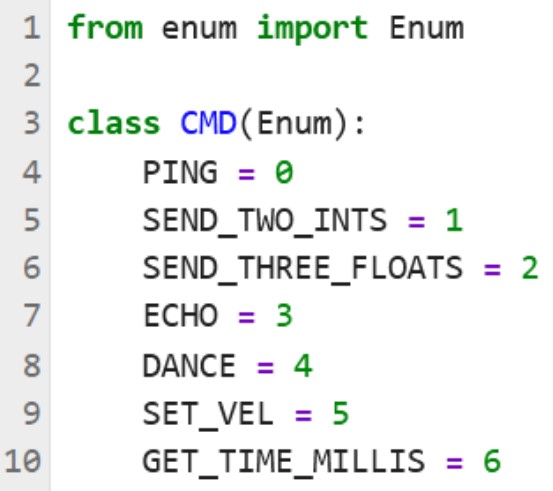
To add the new command GET_TIME_MILLIS to class CMD, I modified cmd_types.py and CommandTypes in ble_arduino.ino.
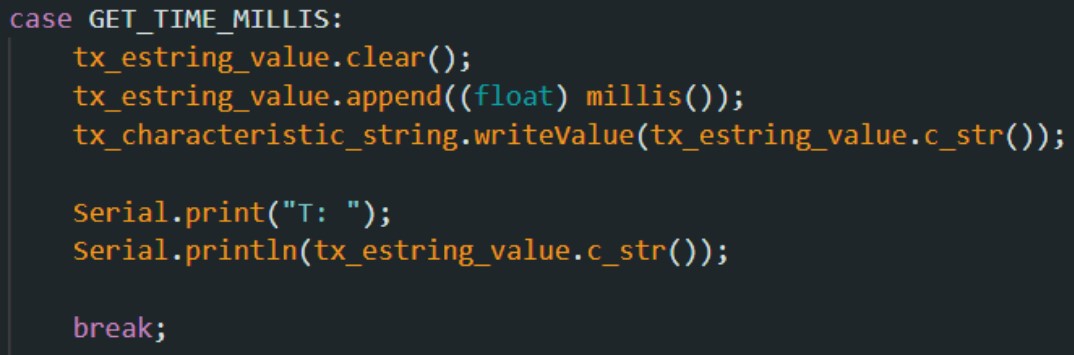
I created a new case for GET_TIME_MILLIS and wrote the following code.
In a Jupyter notebook, I ran the following code to make the robot output a time stamp to the string characteristic.
The Artemis board outputs the time to the Serial Monitor in milliseconds.
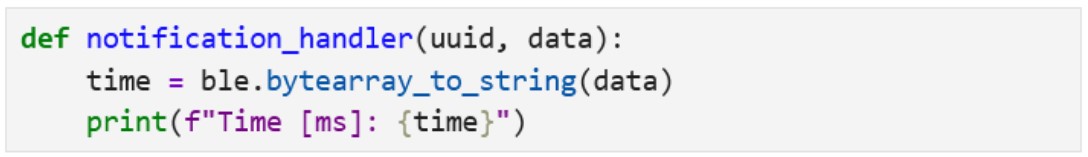
I wrote the following code to create a notification handler in a Jupyter notebook to retrieve the string value from the Artemis board. This string value contains the time stamp from the board.
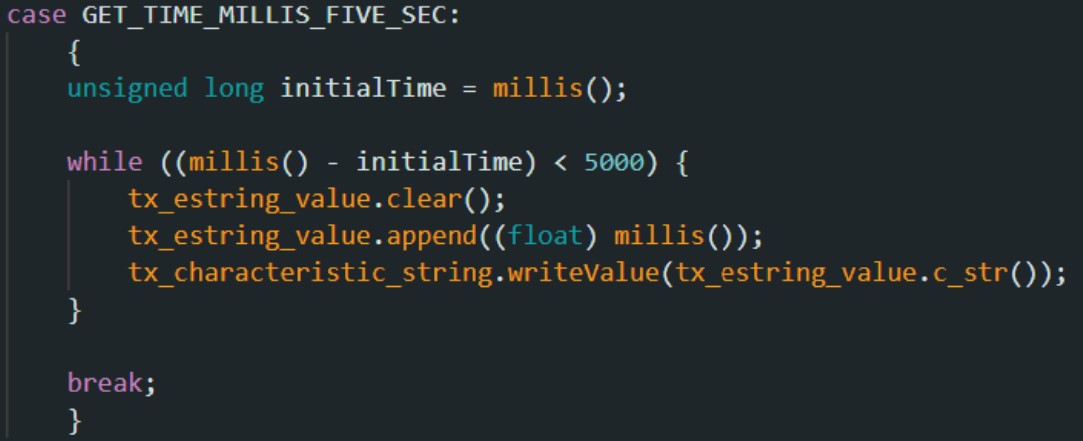
I created a new command GET_TIME_MILLIS_FIVE_SEC by modifying cmd_types.py and CommandTypes in ble_arduino.ino.
I created a new case GET_TIME_MILLIS_FIVE_SEC and wrote the following code.
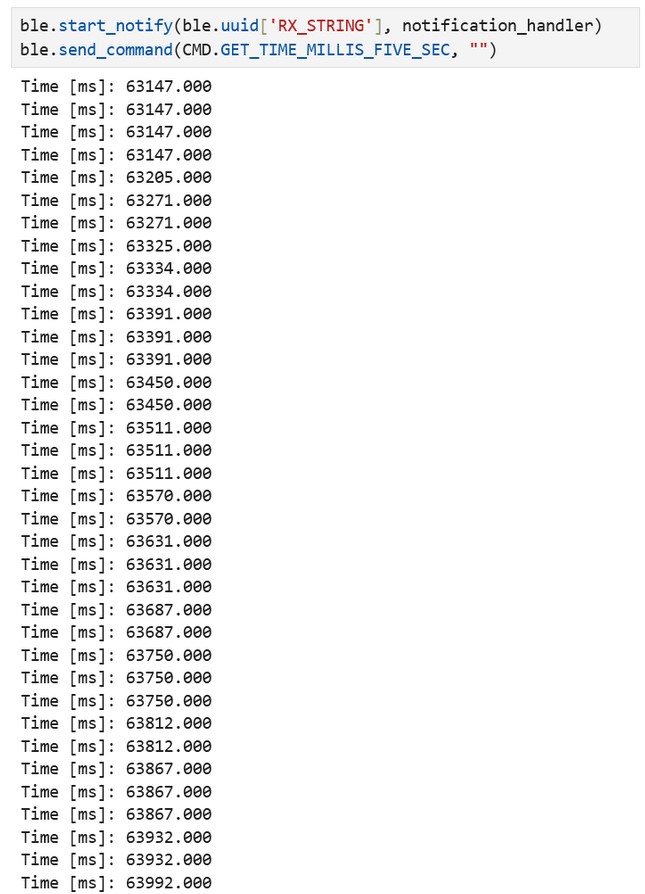
In Jupyter notebook, this code prints as many time stamps as possible in 5 seconds. The output is shown in the notebook instead of the Serial Monitor.
In these 5 seconds, 213 messages totaling 4,473 bytes were received from the Artemis board. This is an effective 42.6 messages or 894.6 bytes per second.
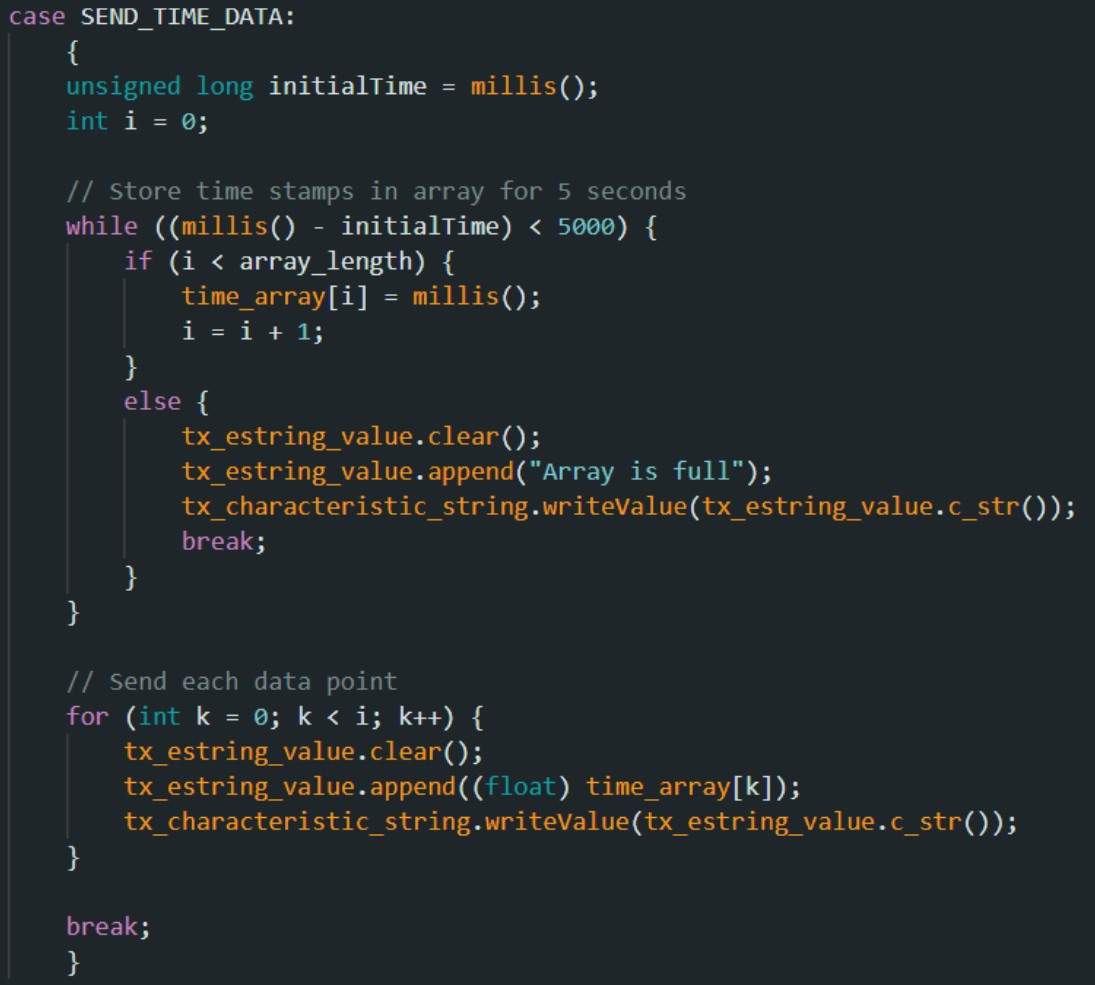
I created a new command SEND_TIME_DATA by modifying cmd_types.py and CommandTypes in ble_arduino.ino, similar to Tasks 3 and 5. I created an array time_array with a size of 300 in the global variables.
I created a new case and wrote the following code. The time stamps are stored into time_array for up to 5 seconds or until the array is full. After 5 seconds or the array is full, the notification handler receives each data point in the array as a string.
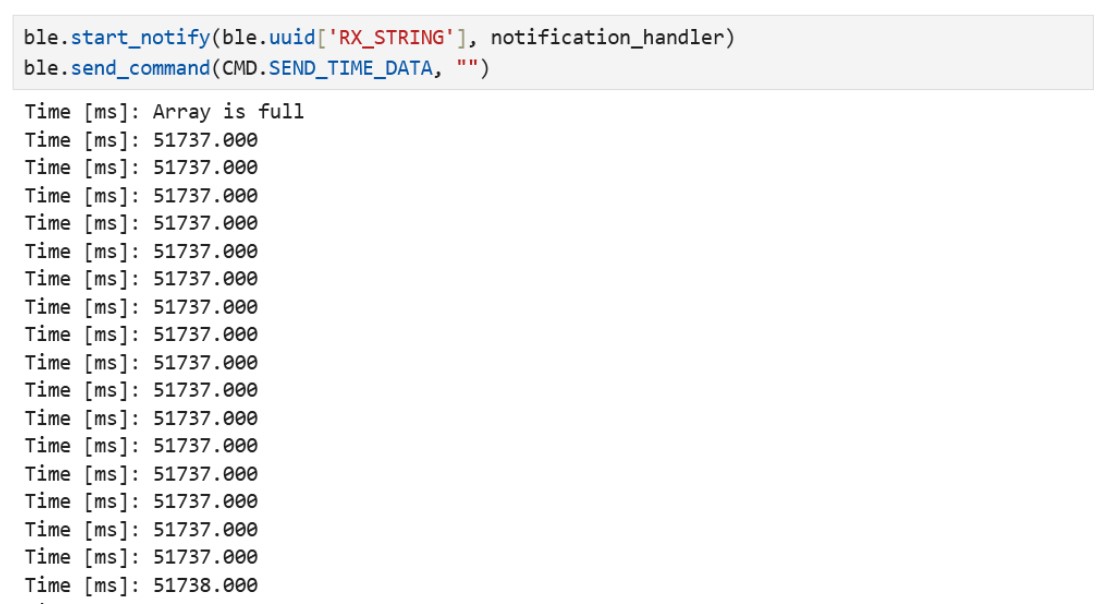
In Jupyter notebook, this code displays all of the time stamps in the array.
The array is full after 11 ms and stored 300 time stamps totaling 6,300 bytes. This is an effective rate of 572,727 bytes (or 0.573 megabytes) per second.
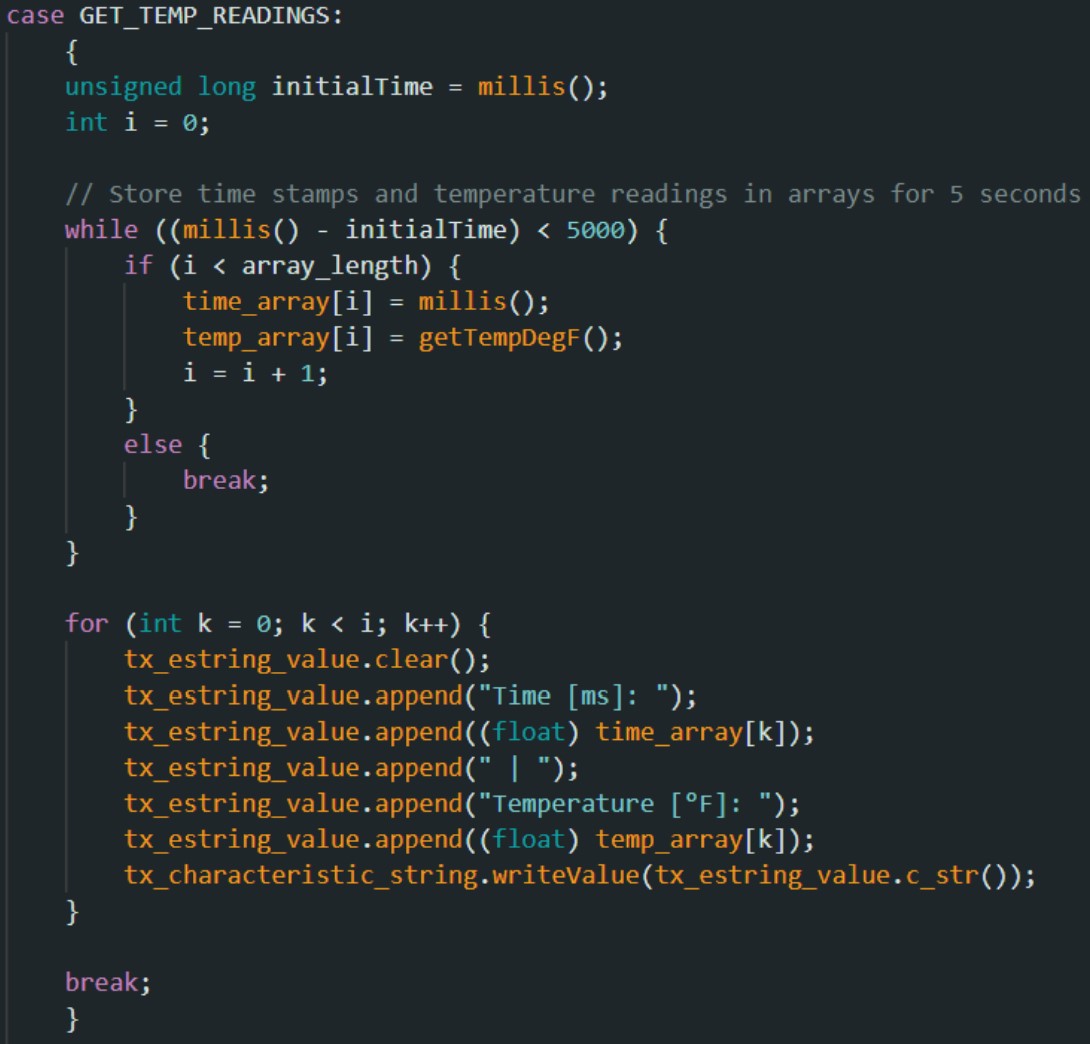
I created a new command GET_TEMP_READINGS by modifying cmd_types.py and CommandTypes in ble_arduino.ino, similar to Tasks 3 and 5. I created a new array temp_array with the same size of 300.
unsignedlongtemp_array[array_length];
I created a new case and wrote the following code. Similar to Task 6, the temperature readings are stored into temp_array for up to 5 seconds or until the array is full.
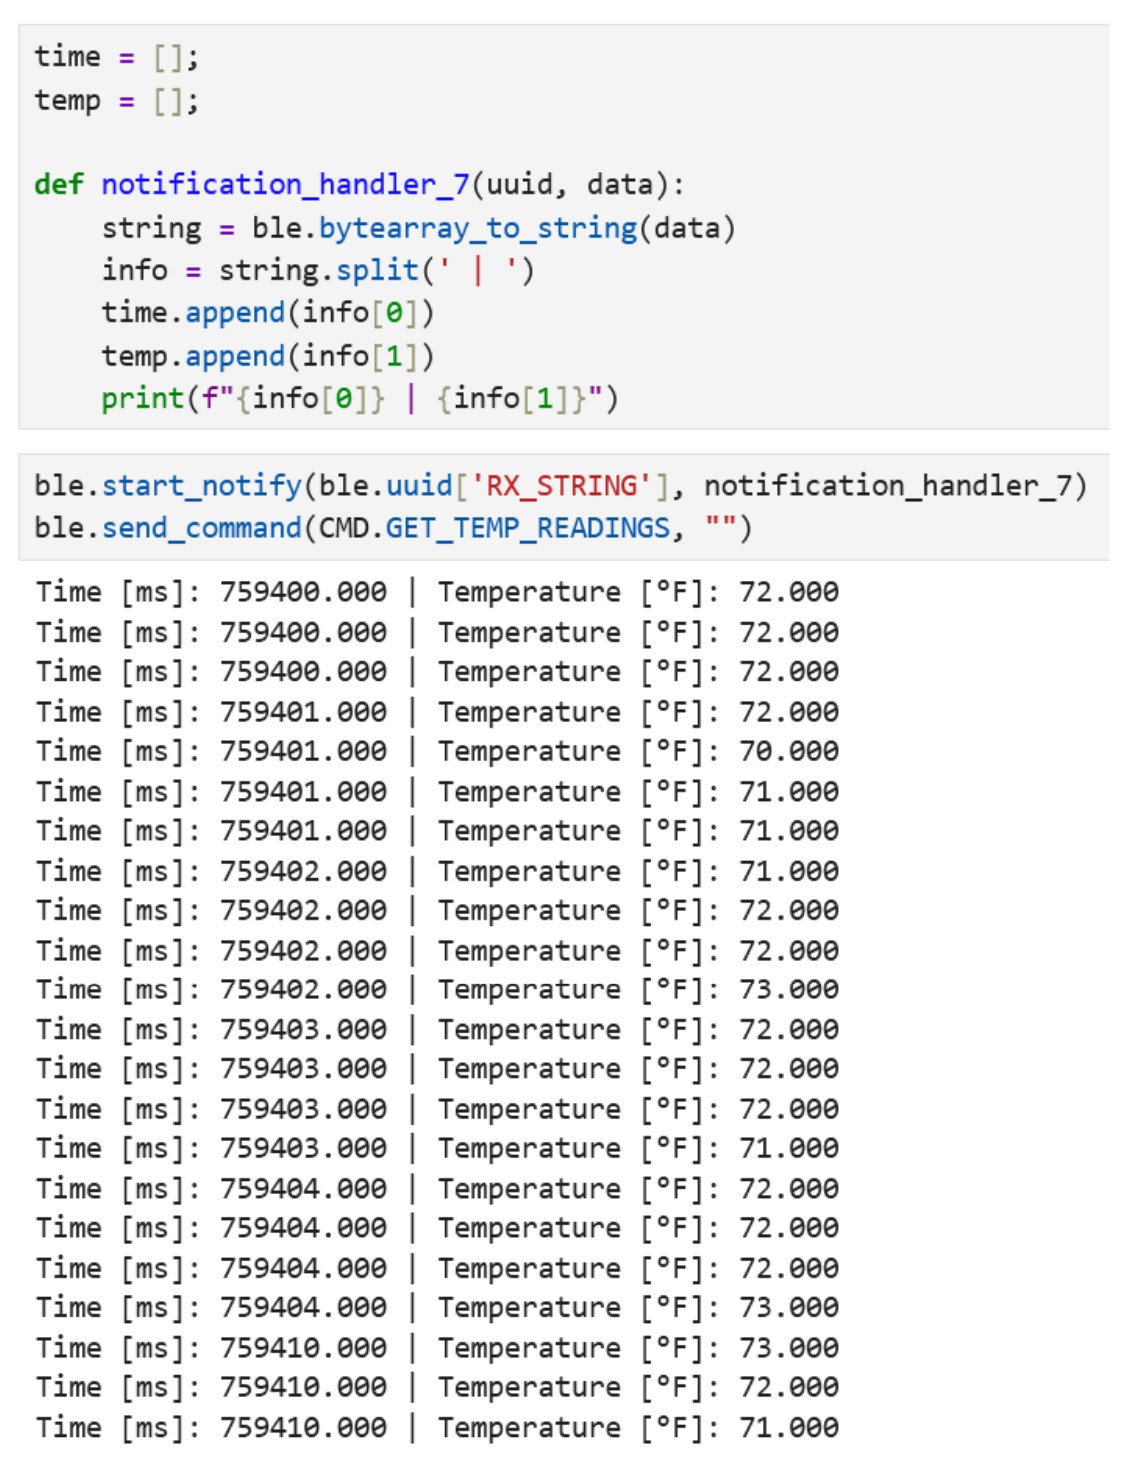
I created a new notification handler to parse through the string and add the information into two dedicated lists for time and temperature.
The array is full after 117 ms and stored 300 time stamps and temperature readings totaling 15,000 bytes. This is an effective rate of 128,205 bytes per second.
The second method involving adding information to an array offers a much greater data transfer rate than sending data every loop iteration. The advantage of the first method (Task 5) is that it allows us to see the data in real-time, but a disadvantage is a much slower data transfer rate. The advantage of the second method (Tasks 6 and 7) is less overhead which allows higher transfer rates, but a disadvantage is that this method is RAM intensive. The first method is best for live monitoring of low-frequency signals, the second method is best for lab equipment that requires high sampling rates.
The second method recorded about 573 kB/s in Task 6 and about 128 kB/s in Task 7. With a RAM of 384 kB, this means you can only record 0.67 seconds in Task 6 or 3 seconds of data in Task 7.
Additional Tasks for 5000-Level Students
Discussion
This lab shows how we can receive time-stamped messages from the Artemis board. The notification handler allows us to see the outputs in Jupyter notebook instead of using Serial Monitor in the Arduino IDE. One thing I noticed is that if a variable is defined in a case, the entire case has to be enclosed in braces for the code to compile.
Collaborators
I collaborated with Sam Zhen while working on this lab. I also looked at Selena Yao’s 2025 website and Angela Voo’s 2025 website as references.